Decisions backed by data
Choose locations and time slots from actual pedestrian volume, not assumptions about a suburb.
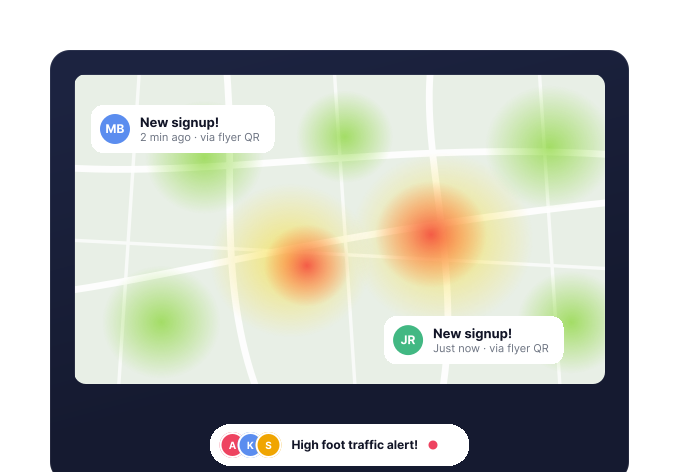
Bring your direct mail, flyering and unaddressed mail campaigns into Oppizi OS and plan them on real data
Decide where and when to distribute using pedestrian data instead of a hunch.
Choose locations and time slots from actual pedestrian volume, not assumptions about a suburb.
Meet your audience when they are genuinely on the footpath, which lifts scans and conversions.
Concentrate spend on the peak hours and busiest corners rather than spreading it thin.
Know which precincts carry volume in a compact market where a few good spots cover a lot of the city.
Still weighing it up? Our New Zealand team is happy to talk it through.
Footfall analysis is the study of how many people pass through a given place, and when. For offline campaigns it tells you which streets, stations and precincts carry real pedestrian volume, and at which hours, so you can plan distribution around the traffic instead of guessing at it.
It shows you the peak locations and peak hours before you book anything. Put a team on a corner during its busiest window and each shift reaches more of your audience, which lifts scan rates and lowers your cost per acquisition on the same budget.
Yes. Select the area you care about, whether that is a single street, a transport hub or a retail precinct in Auckland, Wellington or Christchurch, and the tool returns the footfall picture for that spot so you can compare it against alternatives.
Event organisers use it to time openings and gate staffing, and retailers use it to set trading hours and roster shifts around the busiest periods. Anyone deciding where to put people or promotion in a physical place gets something out of it.