Decisions backed by data
Pick locations and hours from footfall patterns rather than from what looks busy on a map.
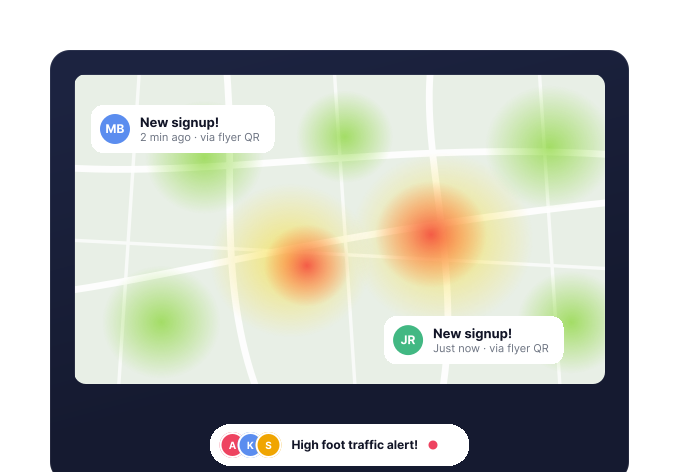
Bring your direct mail and flyering campaigns into Oppizi OS and put every leaflet where the crowd already is.
Guesswork is expensive. A footfall calculator tells you where and when your audience is actually on the street, before the print order goes in.
Pick locations and hours from footfall patterns rather than from what looks busy on a map.
Be on the pitch when your audience is passing, so more flyers reach someone who cares.
Concentrate spend on peak windows and drop the pitches that never justify the staffing.
Know which high streets and stations perform before your competitors work it out.
Not finding your answer? Our team will happily talk it through.
Footfall analysis looks at how many people move through a given place and at what times, so you can see the rhythm of a high street, a station entrance, or a retail park across the day and the week. Marketers use it to decide where to advertise and when to distribute, instead of relying on assumptions about which spots are busy.
Pick a location on the map and the footfall calculator gives you an indication of pedestrian activity there, so you can compare one pitch against another before committing budget. It is free to use and needs no account, and the same signals feed the AI-assisted planning we use to build flyering schedules inside Oppizi OS.
Knowing the peak hours tells you when to staff a pitch, and comparing locations tells you which ones deserve the volume. Brands typically use it to shift missions towards the commute or the lunch hour, to swap an underperforming high street for a busier one, and to place door drop rounds near the areas their customers already walk through.
Yes. You can look at individual streets, transport hubs, retail parks, and town centres, so the read is as local as your campaign. That matters in UK cities where two streets a few minutes apart can behave completely differently at the same hour.
Marketers planning flyering or leaflet distribution, retailers deciding opening hours and staffing, event teams choosing timings, and anyone weighing up a new site. If the answer to your question starts with where or when, footfall data is usually the fastest way to get to it.