Last updated July 23, 2026
All too often, sales teams are simply focused on closing deals without fully understanding what’s driving sales, or worse, what’s slowing them down. This is where sales metrics come in.
Tracking the right sales metrics gives you the visibility you need to optimize performance, improve processes, and make strategic decisions that drive growth. Knowing these numbers is crucial whether you're a startup founder, a marketing executive, or a seasoned sales director.
In this guide, we’ll explore what sales metrics are, look at examples of key metrics, explain how and when to use them, and highlight why tracking them matters.
What are sales metrics?
Sales metrics are data points that measure sales performance, process efficiency, and outcomes. They give insights into how well your sales team is doing and whether your strategies are working.
Some metrics focus on activities (like the number of calls made), while others zoom in on results (like revenue closed). Combined, they offer a complete overview of your sales operations - where the bottlenecks are, which tactics are working, and how to scale.
Examples of sales metrics
Here are just a few key sales metrics that businesses track regularly:
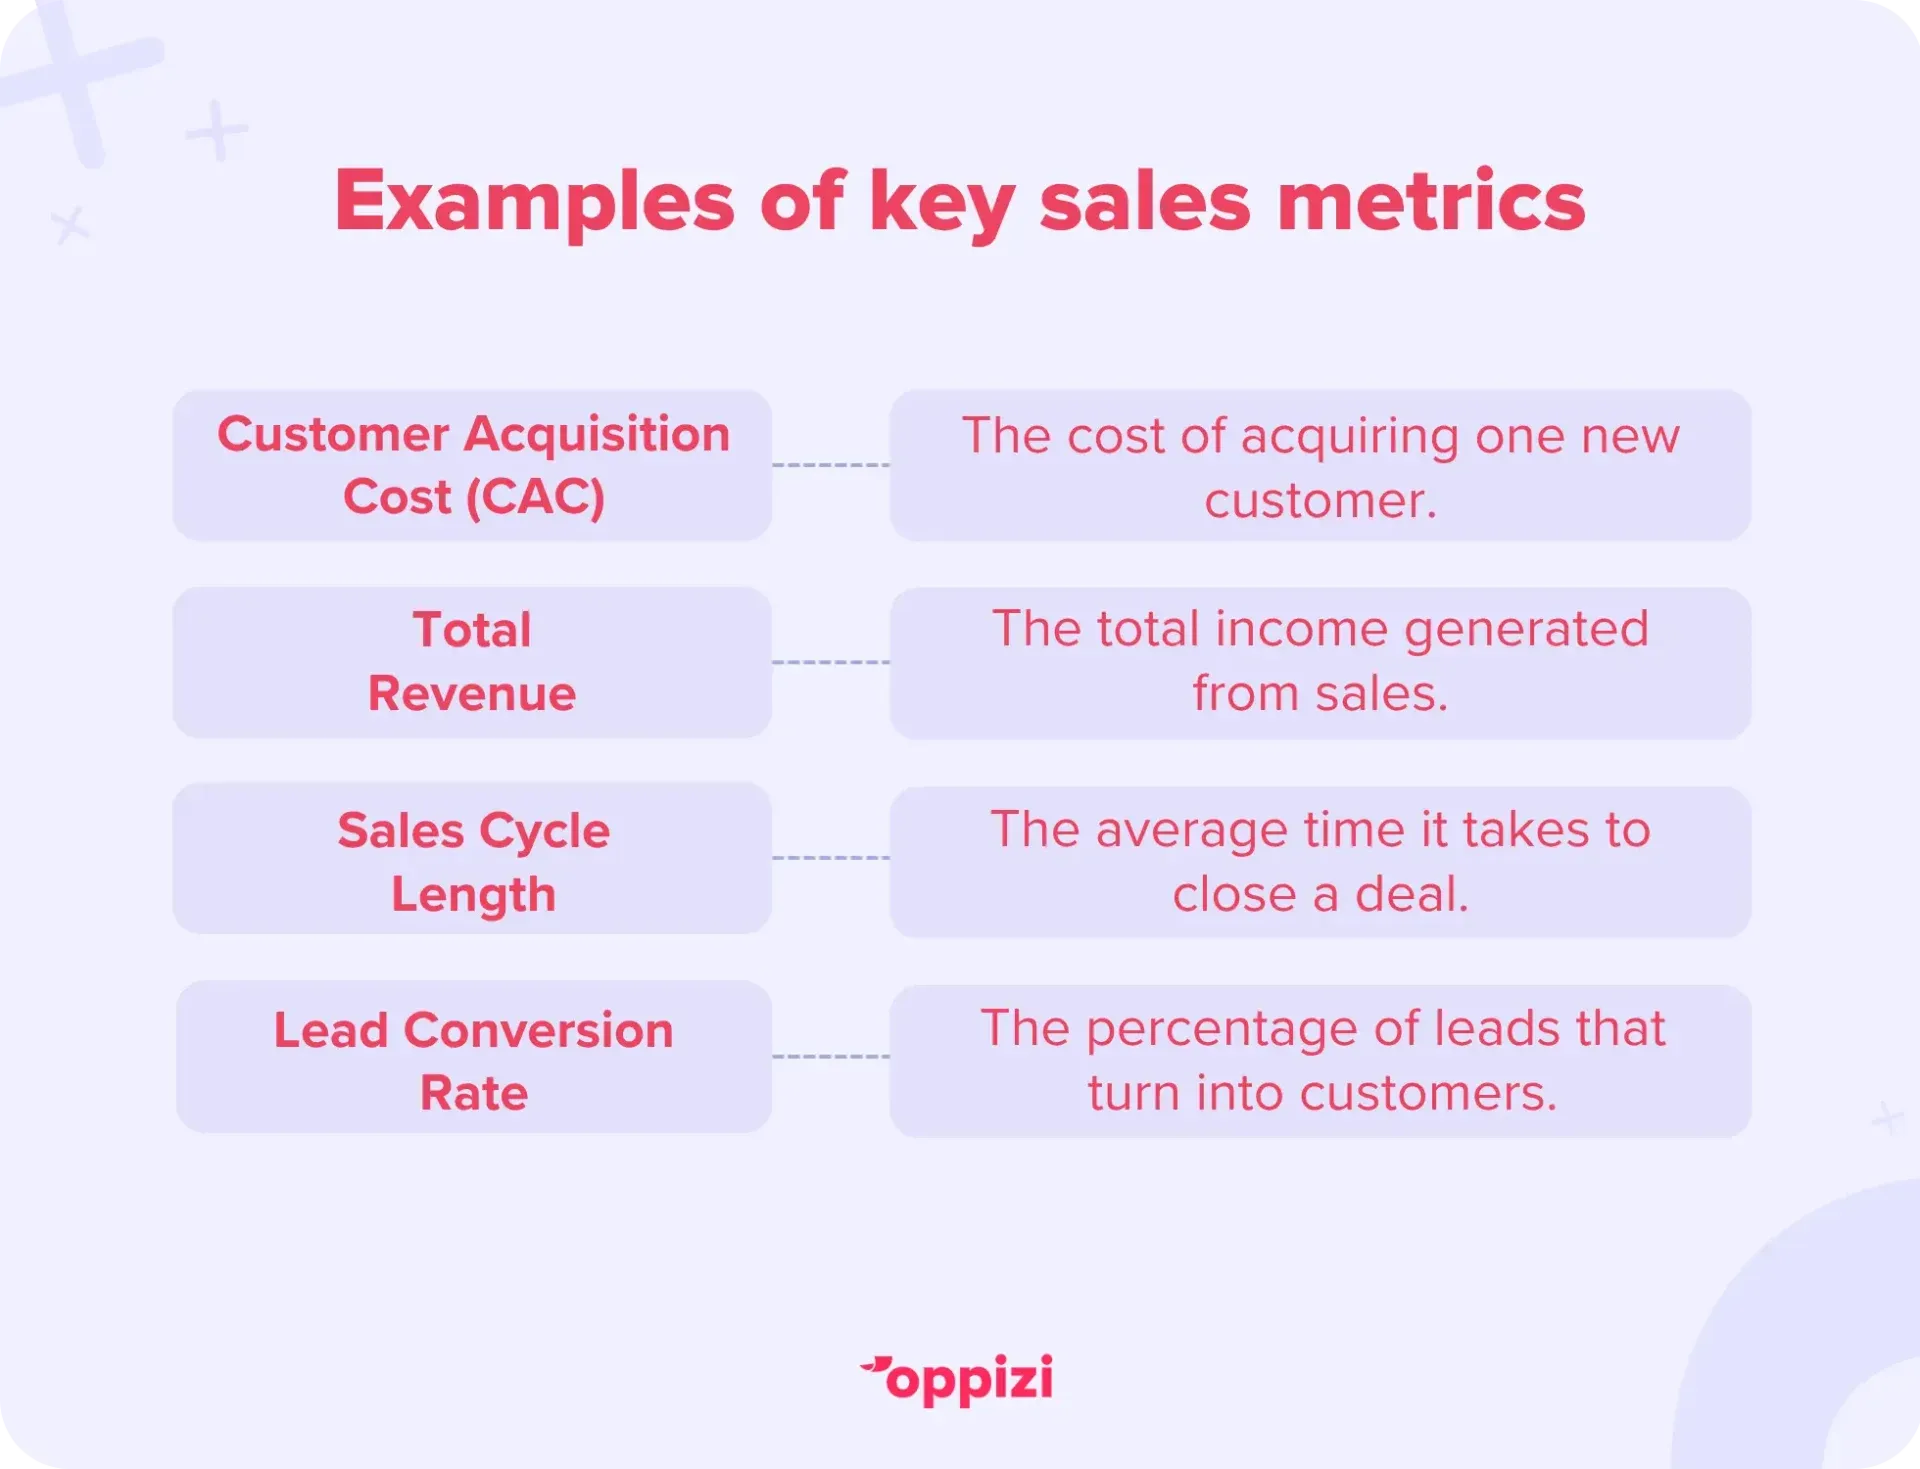
- Total Revenue: The total income generated from sales.
- Lead Conversion Rate: The percentage of leads that turn into customers.
- Customer Acquisition Cost (CAC): The cost of acquiring one new customer.
- Sales Cycle Length: The average time it takes to close a deal.
- Sales Win Rate: The percentage of deals won compared to those pitched.
- Revenue per Sales Rep: Measures the revenue generated from each individual.
- Pipeline Coverage: The ratio between your pipeline value and your sales target.
- Churn Rate: The percentage of customers leaving (significant for SaaS and subscription models).
- Sales Activity Metrics: These include calls made, emails sent, demos booked, etc.
Not all of these metrics will be relevant to every business, but identifying your most important metrics can give you a huge advantage.

Top sales metrics to track (and when)
1. Lead-to-Customer Conversion Rate
What it tells you:
How effective your sales process is at turning leads into customers.
When to track:
Monthly or quarterly.
Why it matters:
A high volume of leads means nothing if none of them convert. This metric shows if your funnel is actually working as it should.
How to calculate it:
(Number of Customers ÷ Number of Leads)×100
Example:
If you had 100 leads and 25 became customers:(25 ÷ 100) × 100 = 25% conversion rate.
2. Customer Acquisition Cost (CAC)
What it tells you:
How much you spend for every customer you acquire.
When to track:
Monthly, quarterly, or per campaign.
Why it matters:
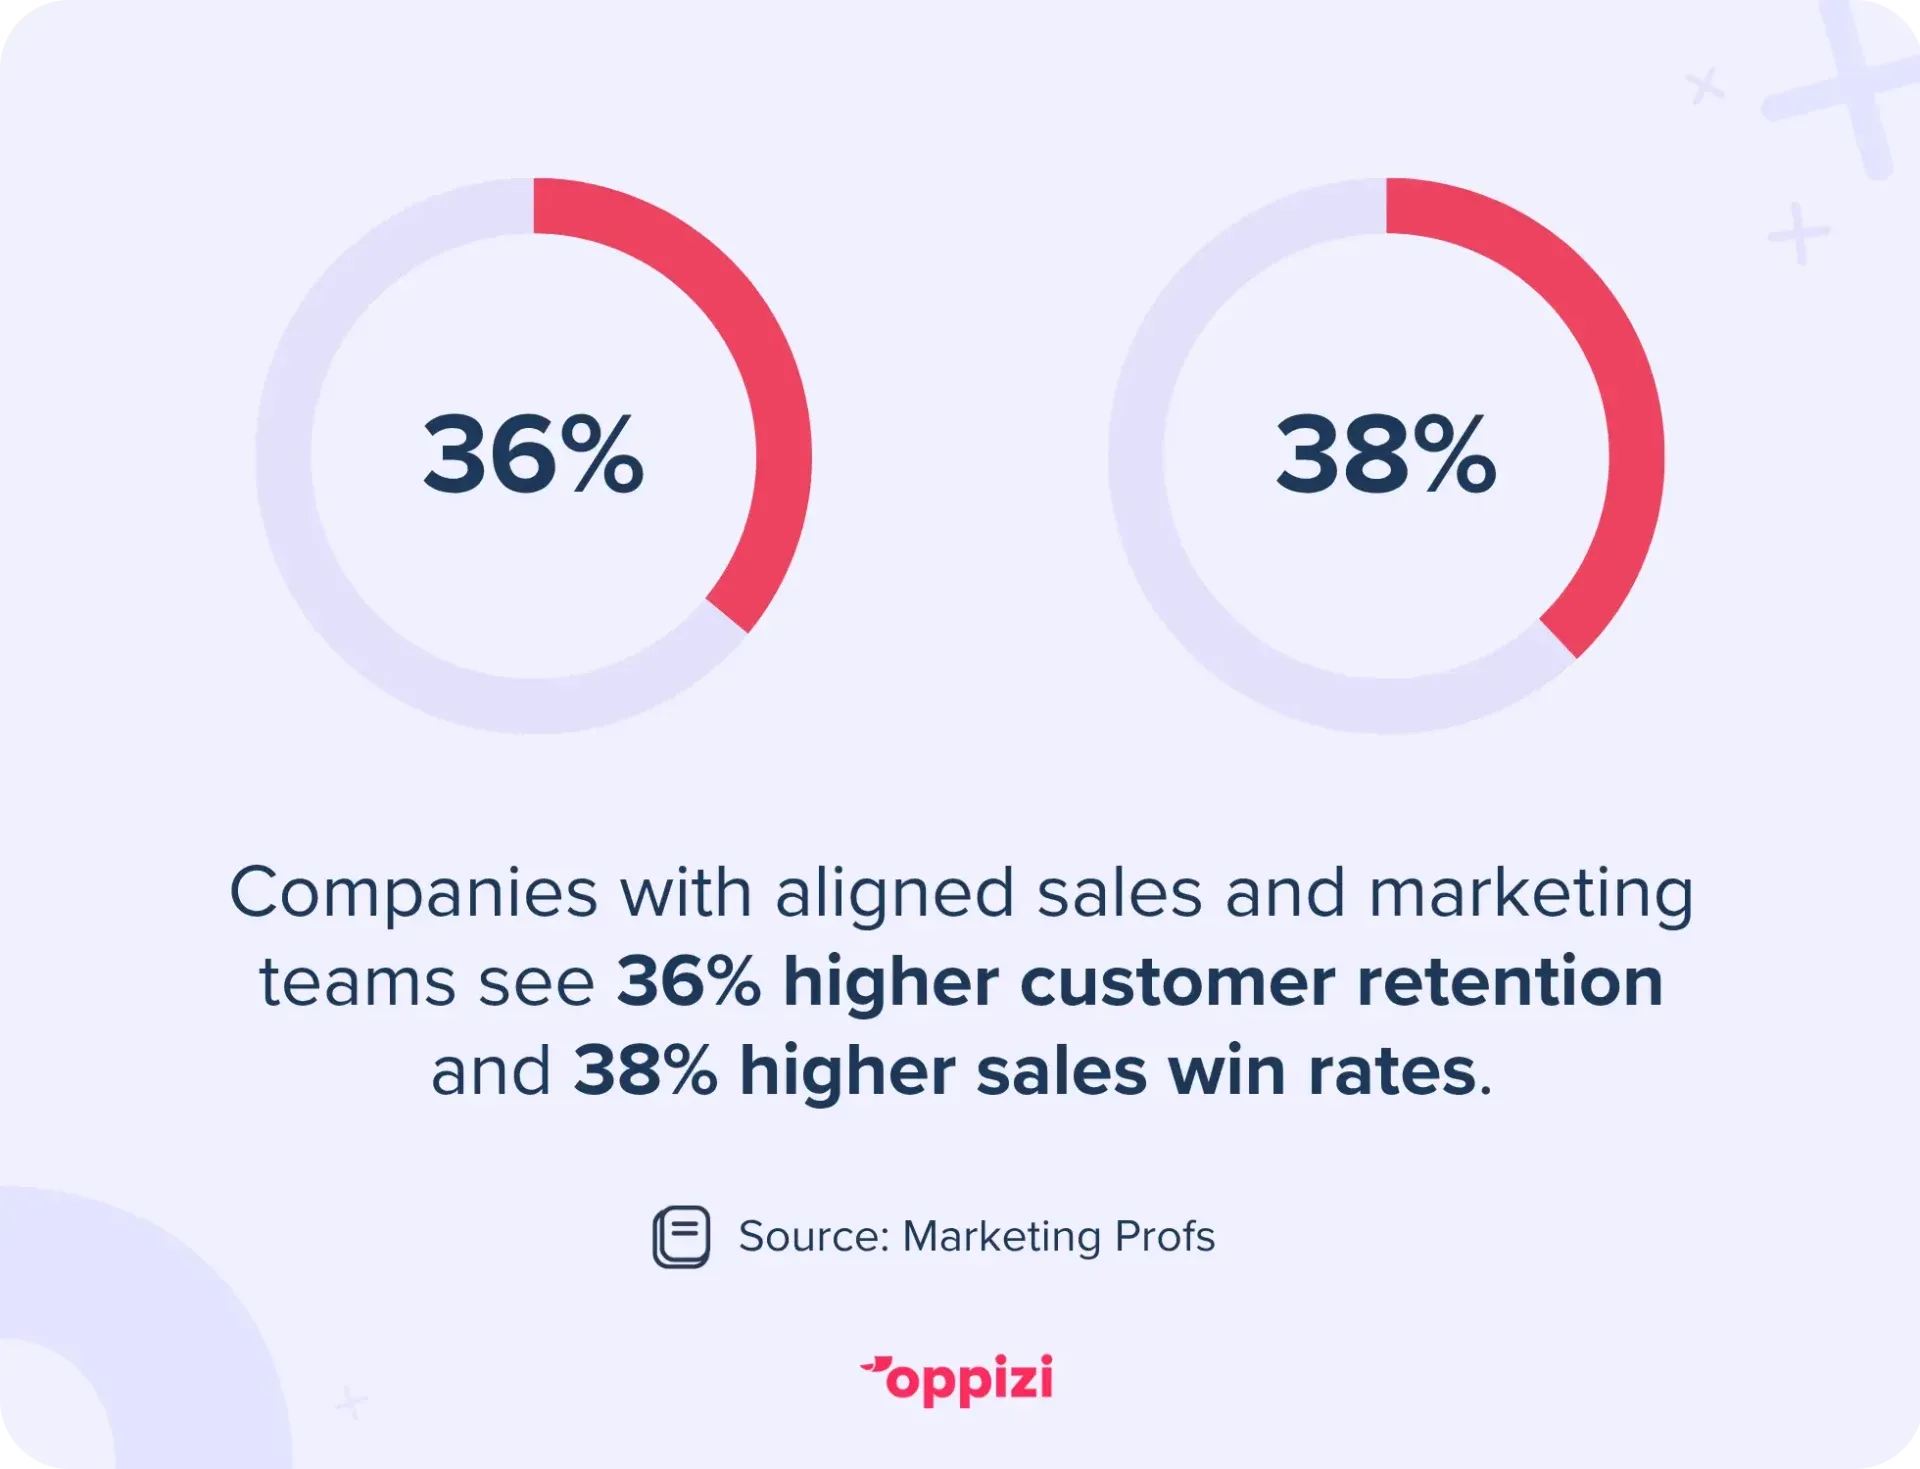
CAC helps assess the profitability of your sales efforts and marketing channels. When sales and marketing are aligned, acquisition becomes smoother, faster, and more cost-effective. In fact, companies with aligned sales and marketing teams see 36% higher customer retention and 38% higher sales win rates.
How to calculate it:
Total Sales & Marketing Costs ÷ Number of New Customers
Example:
If you spent $10,000 on sales and marketing and gained 50 customers:10,000 ÷ 50 = $200 CAC.
3. Sales Pipeline Coverage
What it tells you:
Whether you have enough deals in progress to hit your revenue targets.
When to track:
Weekly or monthly.
Why it matters:
This is a predictive metric. A pipeline that’s too thin could cause issues down the line.
How to calculate it:
Total Pipeline Value ÷ Quota (or Sales Target)
Example:
If your sales target is $50,000 and your pipeline is worth $150,000:150,000 ÷ 50,000 = 3x pipeline coverage.
4. Win Rate
What it tells you:
The effectiveness of your sales representatives in closing deals.
When to track:
Monthly.
Why it matters:
It highlights gaps in the likes of messaging, pricing, or targeting.
How to calculate it:
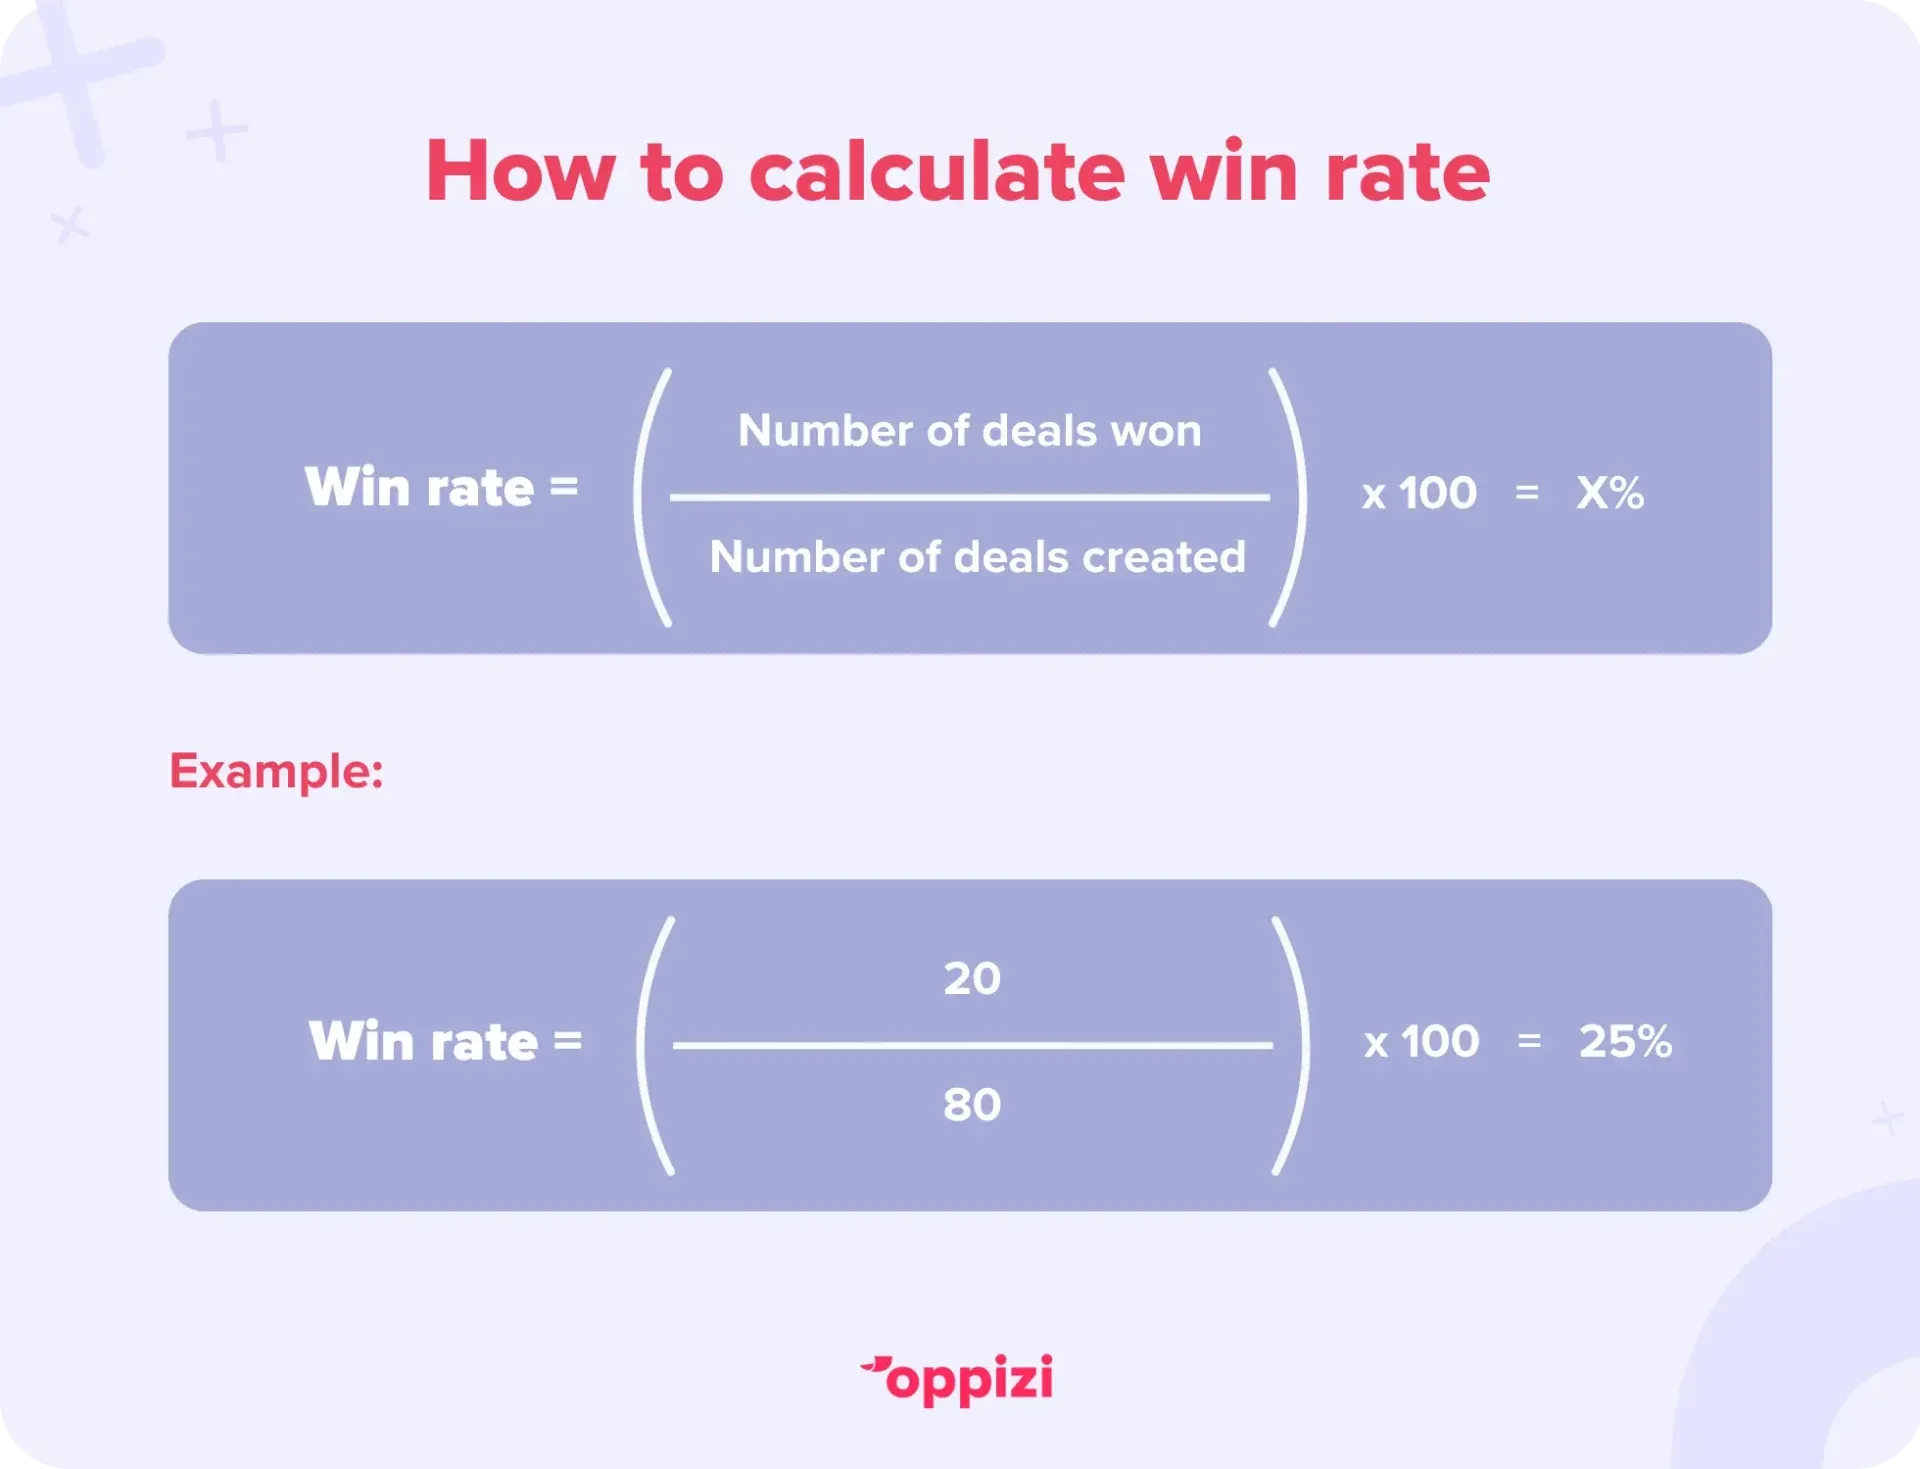
(Number of Deals Won ÷ Number of Deals Created) ×100
Example:
If you closed 20 deals out of 80 opportunities:(20 ÷ 80) × 100 = 25% win rate.
5. Sales Velocity
What it tells you:
How fast your leads move through the funnel and generate revenue.
When to track:
Ongoing, but best reviewed monthly.
Why it matters:
It ties together multiple factors, such as lead volume, conversion rate, deal value, and cycle length, into one powerful metric.
How to calculate it:
(Number of Opportunities × Average Deal Value × Win Rate) ÷ Length of Sales Cycle
Example:
- 40 opportunities
- $2,000 average deal size
- 25% win rate (as a decimal = 0.25)
- 30-day sales cycle
Sales Velocity = (40 × 2,000 × 0.25) ÷ 30 = 66,667 ÷ 30 = $2,222 per day
How to track sales metrics
1. Choose your metrics wisely
You don’t need to track everything - just the numbers that reflect your goals. Focus on leading indicators (like activity) and lagging indicators (like revenue).
2. Use a CRM or dashboard tool
CRMs like HubSpot, Salesforce, and Pipedrive make tracking simple. You can automate reporting, segment data, and drill down by campaign or rep. In fact, 79% of sales teams already use or plan to adopt sales analytics tools to boost performance.
3. Involve your team
Metrics are more powerful when everyone’s aligned. Train your teams to understand how their activities impact key numbers.
4. Set benchmarks
Without a baseline, data has no context. Use historical data or industry averages to identify what ‘good’ looks like.
5. Monitor trends, not just snapshots
One great week doesn’t mean you’ve nailed your strategy. Look at trends over time to get a more accurate read.
Why sales metrics matter
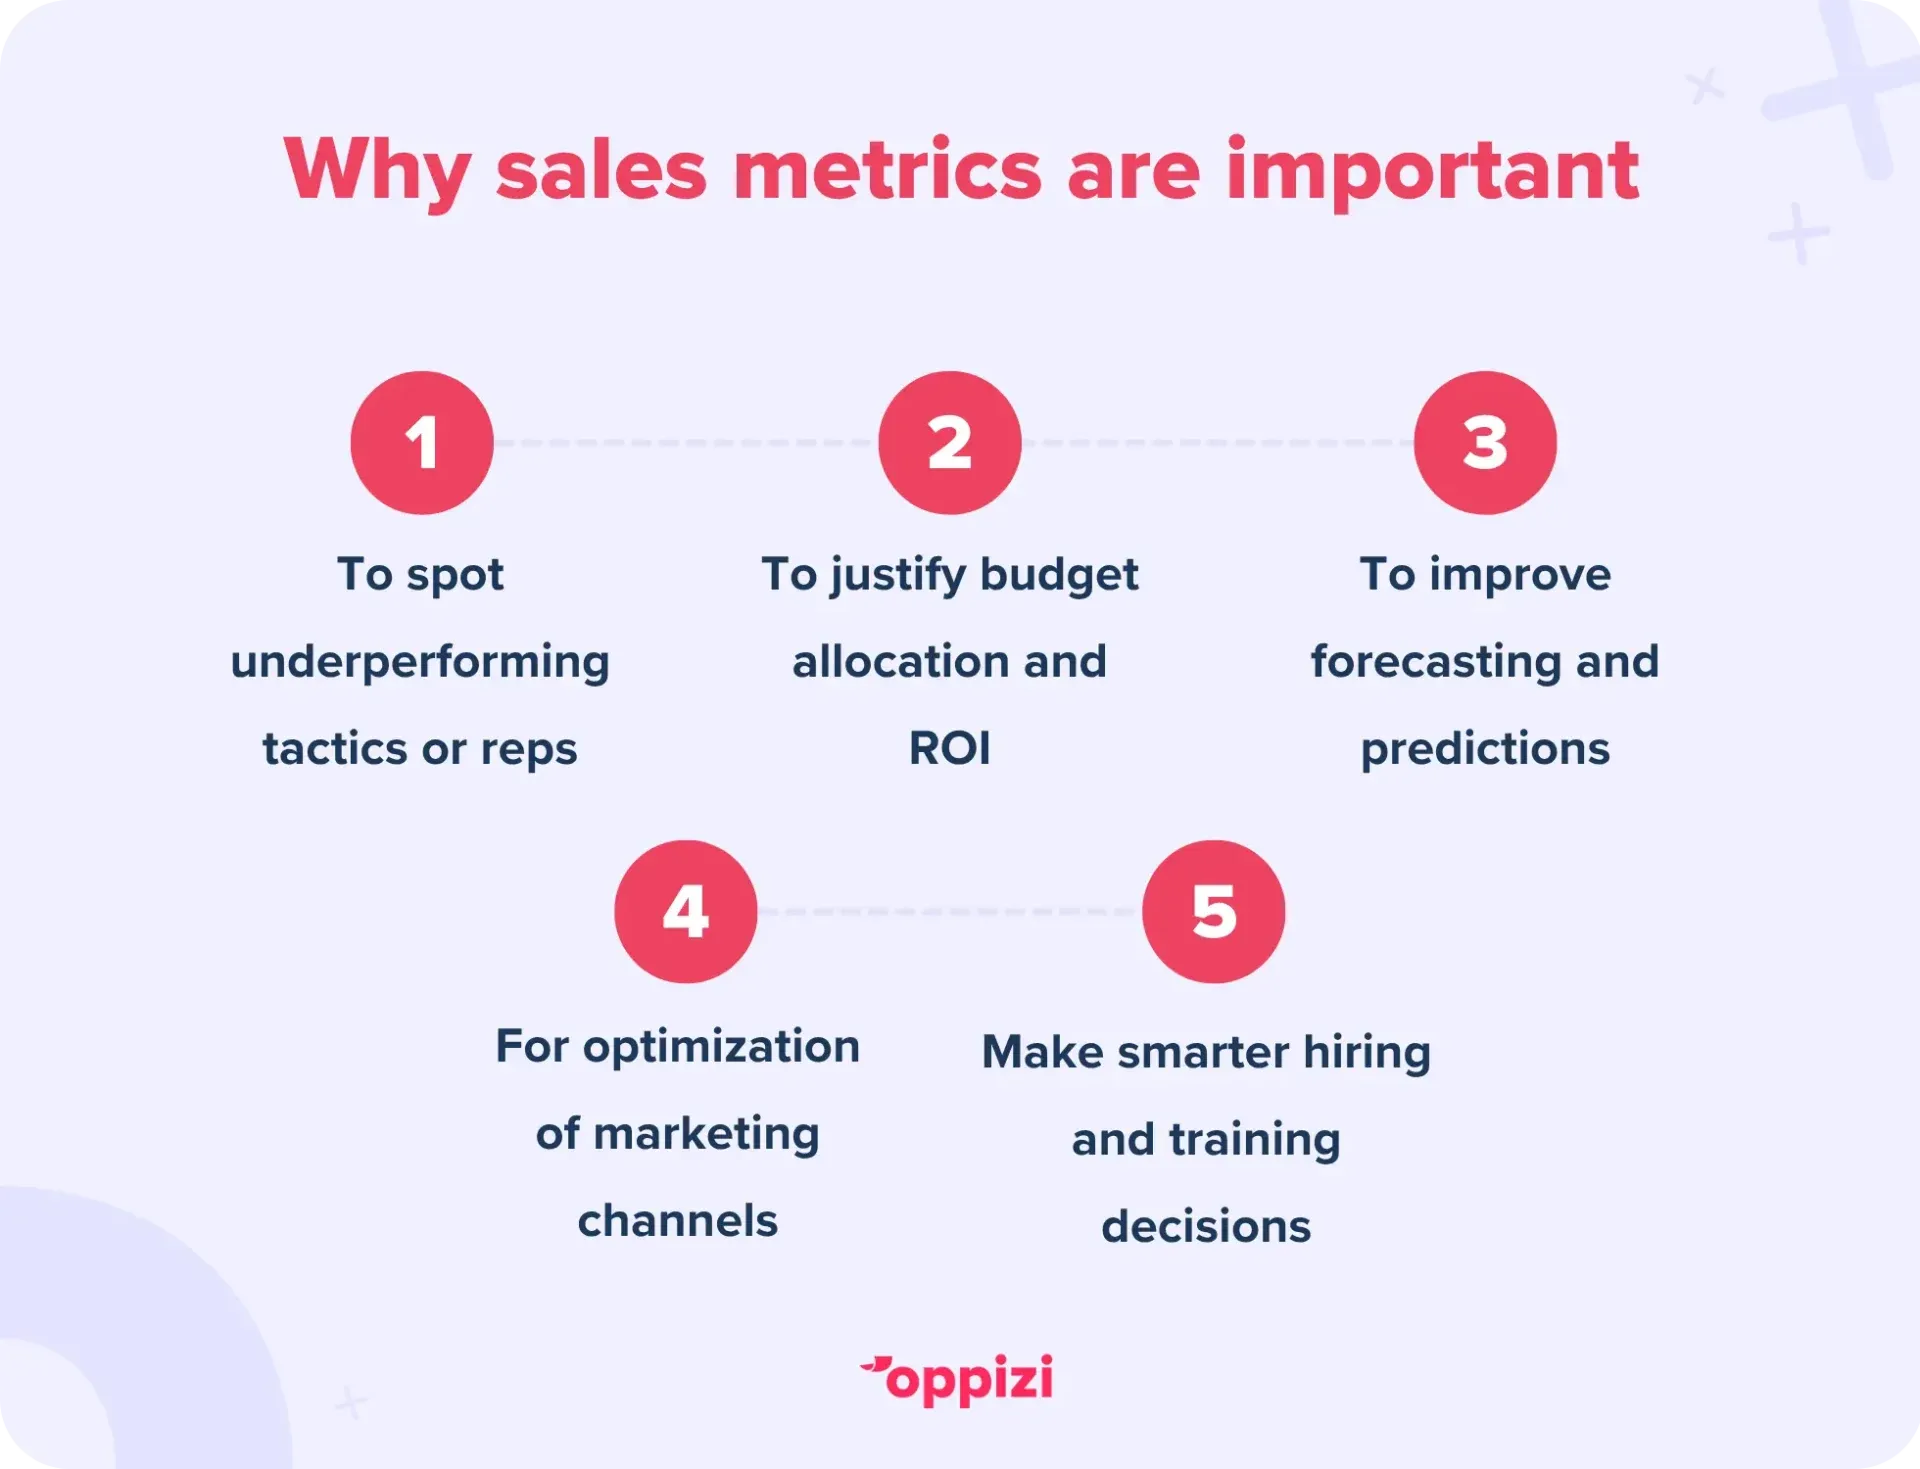
Tracking sales metrics is about more than performance reviews or dashboards. It’s about driving growth strategically.
Here’s what great sales metrics help you do:
- Spot underperforming tactics or reps early
- Justify budget allocation and ROI
- Improve forecasting and predictability
- Optimize marketing channels
- Make smarter hiring and training decisions
In short, sales metrics give you the clarity to act decisively.
FAQ: Sales metrics
What are the three most important sales metrics?
While the most important metrics depend on your business and goals, lead-to-customer conversion rate, customer acquisition cost, and sales pipeline coverage are all essential metrics for understanding performance, profitability, and growth potential.
How do you measure sales performance?
Use a mix of activity-based metrics (calls, demos, meetings) and outcome-based metrics (revenue, win rate, quota attainment). Track them through your CRM or analytics dashboard.
How do you calculate sales efficiency?
Sales Efficiency = Revenue / Total Sales & Marketing Spend. A ratio above 1 means you're generating more revenue than you're spending.

The offline advantage: Sales metrics meet the real world
When most people think of sales metrics, they picture digital funnels, online ads, and CRM dashboards. But offline marketing can (and should) be measured too.
That’s where Oppizi comes in. We help you launch data-driven offline campaigns like flyer distribution, direct mail, and door hangers, all while providing a digital dashboard to track performance in real-time. You’ll see metrics like impressions, conversions, and cost-per-acquisition, just like in your online campaigns.
Final thoughts
If you’re not measuring, you’re just guessing. And in today’s competitive landscape, guessing isn’t good enough. Tracking the right sales metrics empowers you to identify what works, scale it up, and cut what doesn’t.
Want to set up an offline campaign you can measure? Oppizi can help you launch and track your campaign from start to finish, so you can focus on growing your business with clarity.
Ready to start? Launch an offline marketing campaign with Oppizi today!