Last updated July 23, 2026
If you want to make your app better, you need to know how people use it. What are they clicking? What makes them leave? What confuses them?
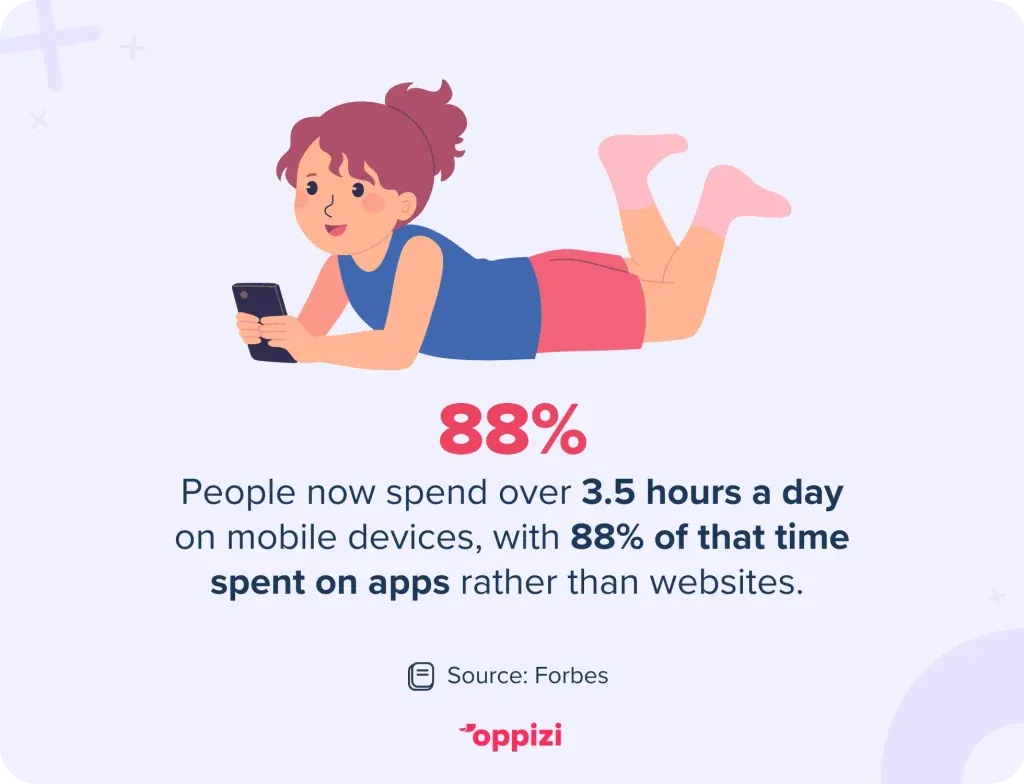
Today, people spend more than 3.5 hours a day on mobile devices, with 88% of that time spent using apps instead of mobile websites. But have you ever wondered what users actually do during this time?
You can’t guess this stuff. But the right tools can show you exactly what’s happening. That way, you can see what’s working, what’s not, and how to make things smoother for your users. Here are some of the best tools to track user behavior in your app:
Third-party software
Third-party software makes it easy to track how users interact with your app. It gives you access to data on user behavior, navigation, and actions within the app. Let’s take a look at some of the best options.
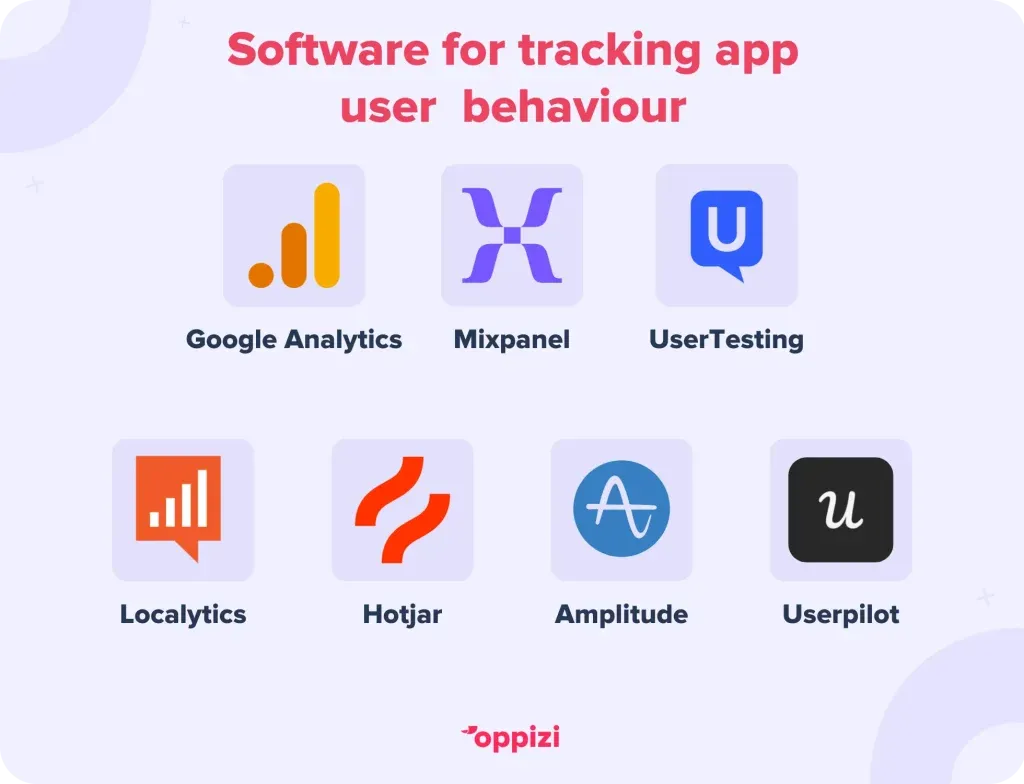
Google Analytics
A popular choice for both websites and apps. It shows you how people use your app, how often they visit, what they do, and how long they stay. You can track clicks, test changes, and even see how different versions of your app perform. It’s free to start, but bigger teams might want the paid version for extra features.
Mixpanel
Mixpanel tracks what users do over time, like who keeps coming back, who drops off, and which features they use. You don’t need to code to set it up. It also helps you group users and follow their journey step-by-step. Helpful for understanding what keeps people engaged.
UserTesting
This tool lets you watch real people use your app. You get honest feedback on what’s easy and what’s frustrating. It’s especially useful when testing new designs or checking how first-time users experience your app.
Localytics
Localytics helps you track how people use your app and send messages based on their behavior. It works across different devices and supports things like push notifications and in-app
Hotjar
Hotjar gives you a full view of what users are doing:
- Heatmaps show where they click or scroll
- Recordings let you watch sessions to spot issues
- Surveys collect direct feedback
- Feedback tools gather real-time input
It’s simple to use and helps both marketers and developers understand the full picture.
Amplitude
Amplitude helps you see the full journey users take in your app, from the moment they open it to when they drop off or convert. You can group users, track funnels, and see how well you’re keeping people engaged. It has a free plan and more advanced options for bigger teams.
Userpilot
Userpilot helps you guide new users and track what they do. You can build in-app walkthroughs, track feature usage, and see what users find helpful. It’s made for teams who want to improve the user journey without switching between tools.
Tools that help you understand how people use your app
If you want your app or website to work better, you need to know what users are doing. What’s confusing them? What are they enjoying? These tools help you find out.
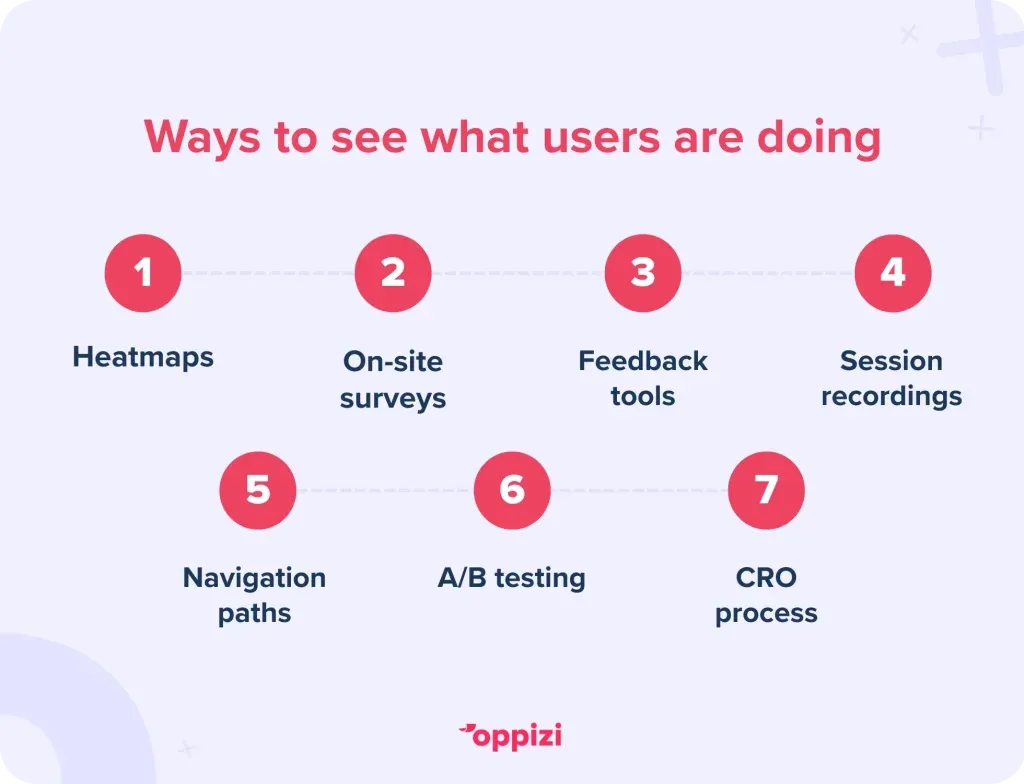
Heatmaps
Heatmaps show you where people click, tap, scroll, or move their mouse. It’s a color-coded map of what’s getting the most attention.
- Red or orange means lots of activity
- Blue or green means less interaction
With heatmaps, you can see:
- Which buttons or links get the most clicks
- Where people pause or stop
- What areas they ignore
- What they look at first
This helps you spot design issues, fix confusing layouts, and make sure people see the most important parts of your app or site.
On-site surveys
On-site surveys ask users for feedback while they’re using your app or website. They’re simple pop-ups or questions that collect opinions on the spot.
Surveys help you:
- Learn how users feel about their experience
- Spot points of confusion or frustration
- Find out what’s missing or needs work
This kind of feedback gives you a clearer picture of what users need. It also shows them that you care about making things better.
Feedback tools
These let users leave open comments about what they like, dislike, or want. It’s less structured than surveys, so users can say exactly what’s on their mind. Feedback helps you understand both:
- How people feel (likes, dislikes, satisfaction)
- What’s working or not (drop-off points, feature use, common issues)
Common feedback includes:
- Hard-to-use navigation
- Confusing content
- Design tweaks
- Feature ideas
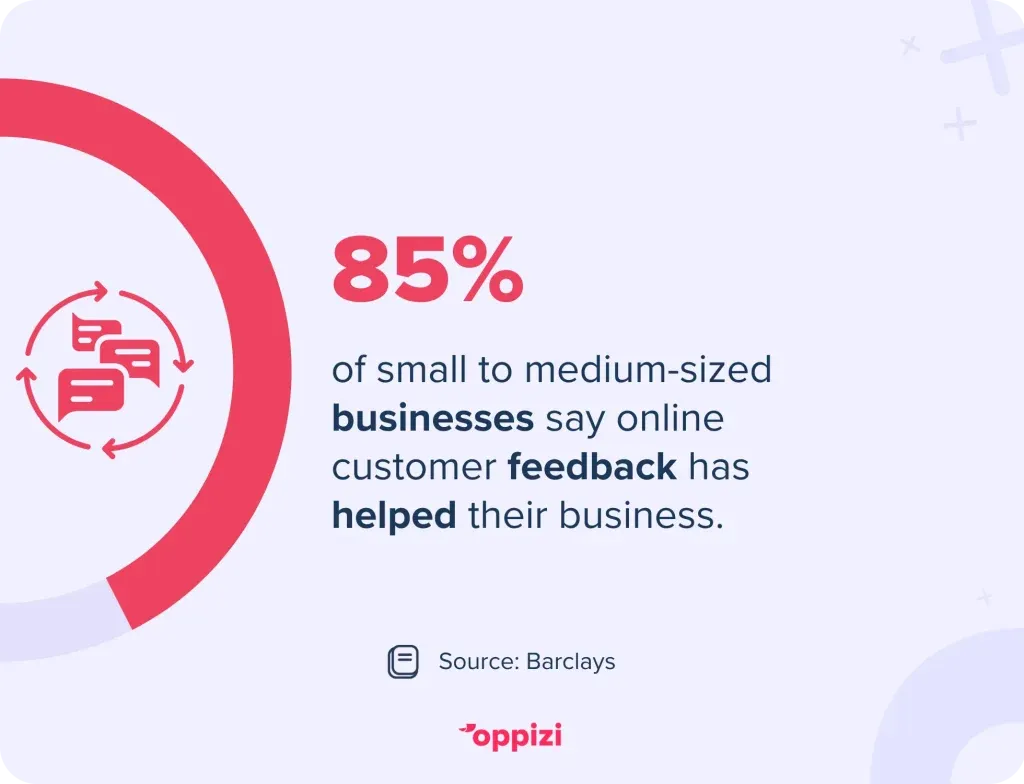
When you check this feedback often, you’ll see patterns. You’ll know what to fix and how to make the user experience smoother. In fact, 85% of small and medium businesses say online reviews and feedback have had a positive impact on their business.
Session recordings
Session recordings let you watch how someone uses your website or app. You can see where they click, scroll, move their mouse, or change pages. It’s like watching a replay of their visit.
Each video shows one user’s journey. It’s not about numbers. It’s about real behavior. With session recordings, you can:
- Spot rage clicks (lots of fast clicks in one spot). That usually means something’s broken or frustrating.
- Find broken buttons or confusing designs that stop users from moving forward.
- See where people pause or hesitate, which might mean the layout or wording needs work.
- Test new designs by watching how people react.
These recordings work even better when you pair them with tools like heatmaps and behavior reports. Numbers tell you what happened. Recordings show you why it happened.
For example, let’s say your form page has a high drop-off rate. A session recording might show users struggling to fill it out or missing an error message. Watching it happen in real time helps you fix what’s really wrong.
Some great tools for this are Hotjar, FullStory, Crazy Egg, and Microsoft Clarity. Most of them let you filter sessions by device, location, or how the person found your site.
Just a heads-up—make sure to follow privacy laws like GDPR and CCPA. Always hide personal info in your recordings.
Navigation paths
Navigation paths show the order of pages or screens someone visits. It’s a map of where users go from the moment they land to when they leave.
This helps you:
- See what people look at first
- Spot the most common routes through your app or site
- Catch patterns like users going back and forth between two pages (a sign they’re confused)
If people keep jumping between the same screens, your layout or links might need some work. You might need to make things clearer or easier to find. Navigation paths also show you where users drop off. That helps you fix weak spots and keep people from leaving too soon.
A/B testing
A/B testing helps you figure out what works best. You show one version of a page or feature to half your users (version A) and a different one to the other half (version B). Then you compare the results.
You can test things like:
- Headlines, images, or layouts
- Signup forms, pricing, or checkout pages
- Call-to-action buttons or text
It’s a smart way to improve your app or website without guessing. You see what real people respond to, and then go with what works.
To run a good test:
- Change one thing at a time
- Make sure enough people see each version
- Let it run for at least 2–4 weeks
- Break down the results by device, traffic source, or location
A/B testing works even better when you pair it with session recordings or heatmaps. If version B performs better, recordings can show why—maybe the new layout was easier to use.
Some tools to help you run tests include Optimizely, VWO, Convert, and (formerly) Google Optimize. A/B testing is a simple way to make smarter decisions and turn more visitors into customers.

CRO process
CRO stands for conversion rate optimization. It’s about helping more people take action, like signing up, buying something, or filling out a form.
Here’s how it works:
- First, you find where users drop off
- Then, figure out what’s stopping them
- Next, fix what’s not working
You also look at:
- What brought them to your site
- What kept them interested
- What made them leave
The goal is to make things clear, smooth, and easy to use. When people have a better experience, they’re more likely to convert. CRO helps you turn traffic into results. Not by guessing, but by learning what real users do, and making changes that match their needs.
FAQ: Tracking app usage and user behavior
What is app usage behavior?
It’s how people use your app. Things like how often they open it, what features they tap on, how long they stay, and when they stop using it. This helps you see what’s working and what needs fixing.
What’s an example of user behavior?
A user tapping a button, watching a video, or making a purchase. It could also be scrolling, skipping steps, or leaving the app halfway. These actions show what users like and where they might be confused.
How do you track user behavior on mobile apps?
You can use tools like Mixpanel, Amplitude, or Hotjar. They track what users do, how long they stay, what they click, and where they go next. Heatmaps, session recordings, and surveys also help you understand why they do what they do.
What are active app users?
Active users are people who open or use your app in a set time.
- DAU (Daily Active Users): People who use the app in one day
- MAU (Monthly Active Users): People who use it at least once in a month
Some apps define it differently, depending on their goals.
How can I see how many active users my app has?
Use a tool like Firebase, Mixpanel, or Amplitude. They track app opens and sessions automatically. You can also see which users come back often, where they’re from, and what they do in your app.

Make better choices with behavior insights
If you want to improve your app, start by watching how people use it. Tools like heatmaps, session replays, surveys, and A/B testing show what’s working and what’s not.
You’ll spot what users need, what confuses them, and what keeps them coming back. No more guessing. Just clear insights that help you build a better experience.
Want help reaching the right audience with data-backed offline marketing? Try Oppizi free today.